
Traveling The World In D3 - Part 1: Making A Map

The Knoyd team is currently spread out all over the world (Chile, Peru and Austria) and I am living on the road for quite a while now. I had the idea to code up an interactive map for my travel blog and thought it would be nice to share with you how to do it yourself.
This is a multipart tutorial. To get started, you can get all the code from GitHub and also see the final product here.
What is D3?
D3.js (or just D3 for Data-Driven Documents) is a JavaScript library for producing dynamic, interactive data visualizations in web browsers. It uses the widely implemented SVG, HTML5, and CSS standards. In contrast to many other libraries, D3.js allows great control over the final visual result.
Overall the library is very low level and it takes a while to get used to, so I wouldn't blame anyone for using some of the libraries built on top of D3 (such as Plotly or Bokeh in Python). But if you want to make something truly custom, you will end up learning D3 anyways.
Part 1: Making a map
1.1 Basic world projection
We start by plotting the map of the world in the Mercator projection:
<meta charset="utf-8"><body><script type="text/javascript" src="https://d3js.org/d3.v4.min.js"></script><script src="trip_data.js"></script><script src="https://unpkg.com/topojson-client@3"></script><script>var width = window.innerWidth,height = window.innerHeight,centered,clicked_point;var projection = d3.geoMercator().translate([width / 2.2, height / 1.5]);var plane_path = d3.geoPath().projection(projection);var svg = d3.select("body").append("svg").attr("width", width).attr("height", height).attr("class", "map");var g = svg.append("g");var path = d3.geoPath().projection(projection);// load and display the Worldd3.json("https://unpkg.com/world-atlas@1/world/110m.json", function(error, topology) {g.selectAll("path").data(topojson.feature(topology, topology.objects.countries).features).enter().append("path").attr("d", path);});</script></body></html>
Let's add some color. We have to already have the trip_data loaded in the code above. We want to color the countries we have visited in a different color. This is a helper function that will do that:
// color countryfunction colorCountry(country) {if (visited_countries.includes(country.id)) {// hack to discolor ehtiopiaif (country.id == '-99' & country.geometry.coordinates[0][0][0] != 20.590405904059054){return '#e7d8ad'} else {return '#c8b98d';};} else {return '#e7d8ad';}};
Now we can select all the path elements (which are the countries polygons) and color them. Put this inside of the d3.json() call above.
g.selectAll('path').attr('fill', colorCountry);
Voila! The results should look something like this:
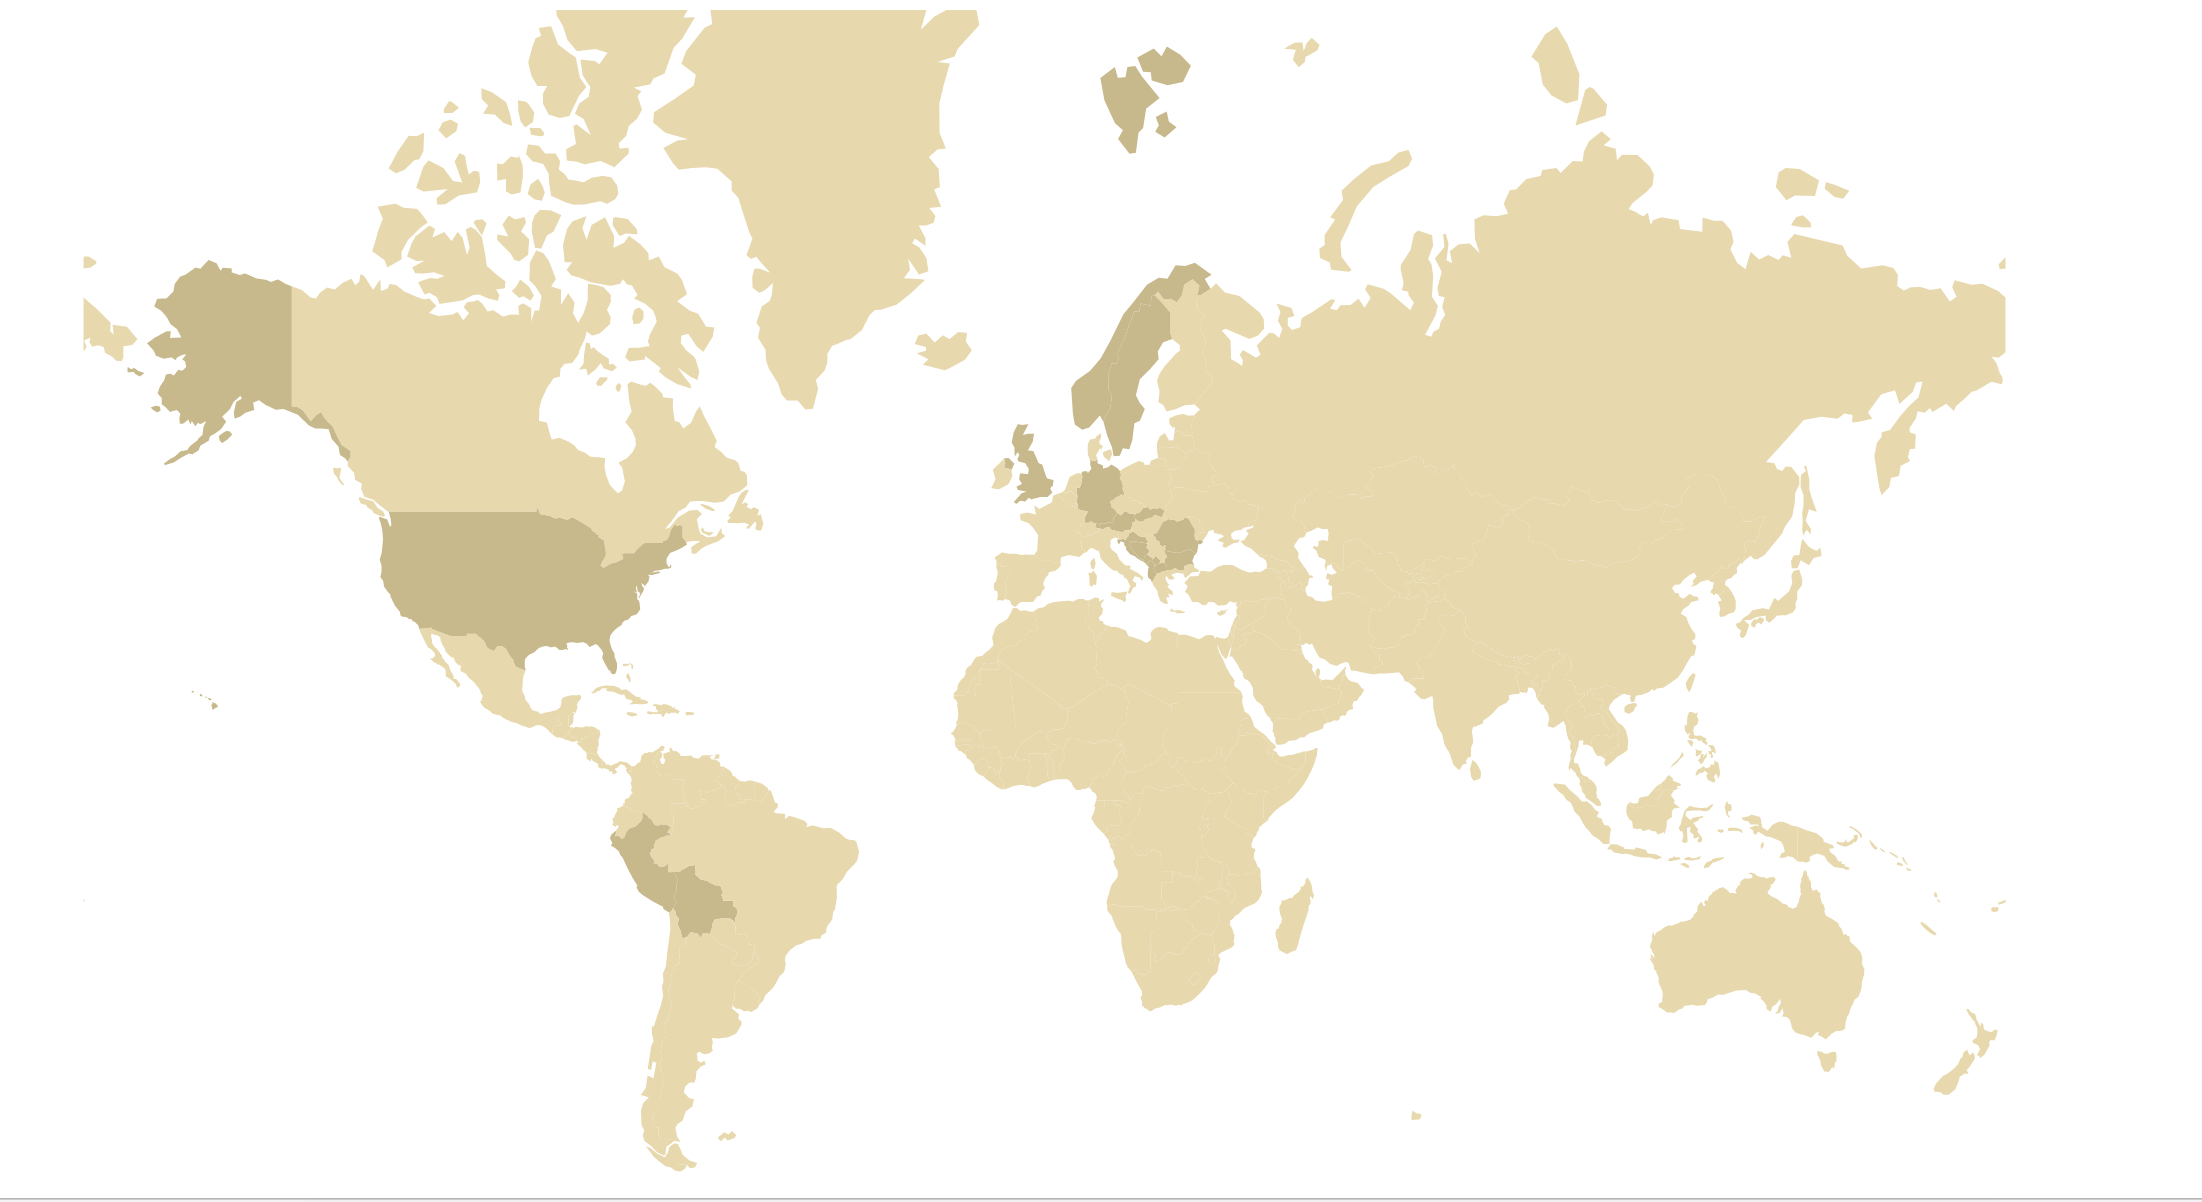
The World map after the first step.
1.2 Zooming into countries:
The next thing we would like is to be able to click and zoom into particular countries. We also want the zoomed in country to have a different color. For this we need to run a transformation on the map projection. Firstly add the click action to the generated path (country) objects.
g.selectAll("path").data(topojson.feature(topology, topology.objects.countries).features).enter().append("path").attr("d", path).on("click", clicked) //adding the click action
We introduced a new function called clicked, so let's take a look at what it looks like.
//clickedfunction clicked(d) {var x, y, k;//if not centered into that country and clicked country in visited countriesif ((d && centered !== d) & (visited_countries.includes(d.id))) {var centroid = path.centroid(d); //get center of countryvar bounds = path.bounds(d); //get bounds of countryvar dx = bounds[1][0] - bounds[0][0], //get bounding boxdy = bounds[1][1] - bounds[0][1];//get transformation valuesx = (bounds[0][0] + bounds[1][0]) / 2;y = (bounds[0][1] + bounds[1][1]) / 2;k = Math.min(width / dx, height / dy);centered = d;} else {//else reset to world viewx = width / 2;y = height / 2;k = 1;centered = null;}//set class of country to .activeg.selectAll("path").classed("active", centered && function(d) { return d === centered; })// make contours thinner before zoom for smoothnessif (centered !== null){g.selectAll("path").style("stroke-width", (0.75 / k) + "px");}// map transitiong.transition()//.style("stroke-width", (0.75 / k) + "px").duration(750).attr("transform", "translate(" + width / 2 + "," + height / 2 + ")scale(" + k + ")translate(" + -x + "," + -y + ")").on('end', function() {if (centered === null){g.selectAll("path").style("stroke-width", (0.75 / k) + "px");}});}
You can see that we have introduced a active CSS class, which is assigned to the zoom in country, and will help us change the color of the country.
.active {fill: #98f5ff;}
We now have working zooming and the countries are changing colors on zoom too ;-)
[youtube=://www.youtube.com/watch?v=DR4DqrPVczo&w=640&h=480]
Next time:
In the next part of this tutorial, we will draw points where we have been to our zoomed in country, add a tooltip with description and icons with links to the actual blog posts about each place.
If you don't wanna miss out, sign up for our newsletter in the bottom right corner.
>>>