
Traveling The World In D3 - Part 2: Points & Links

The Knoyd team is currently spread out all over the world (Chile, Peru and Austria) and I am living on the road for quite a while now. I had an idea to code up an interactive map for our travel blog and thought it would be nice to share with you how to do it yourself.
This is a multipart tutorial. To get started, you can get all the code from GitHub and also see the final product here.
You can also check out Part 1: Making a Map
Part 2: Points & Links
1. Drawing Points
In the last part of the tutorial we managed to make a world map, color the countries we have already visited and making a zoom functionality to get into a detailed view for each country. Once zoomed into a specific country, we would like to see the specific locations, that we have visited in that country. Let's make this possible.
We have to add a couple of parts to our clicked function from the previous part. Firstly we need to subset the points contained in the country that we are zooming into:
// filter only points in the countryvar contained_points = trip_data.filter(function(point) {if (point.country == d.id){ // d is the clicked path object return true;} else {return false;}});
Next we have to remove all the points drawn in previous clicks and draw new points:
// remove all old pointsg.selectAll("image").remove()// if zooming in -> draw points if (centered !== null){ //if zooming INg.selectAll("image").data(contained_points) //draw each point.enter().append("svg:image").attr("xlink:href", "img/location1.png") //location icon.attr("x", function(d) { //project coordinates into the projectionreturn projection([d.lon, d.lat])[0];}).attr("y", function(d) {return projection([d.lon, d.lat])[1];}).attr("width", 30 / k + "px") //set icon size.attr("height", 30 / k + "px")}
We introduced a location symbol ("img/location1.png") for each drawn point. You can easily change this for any other image or just a plain dot. Now we get relevant points drawn on each zoom-in.
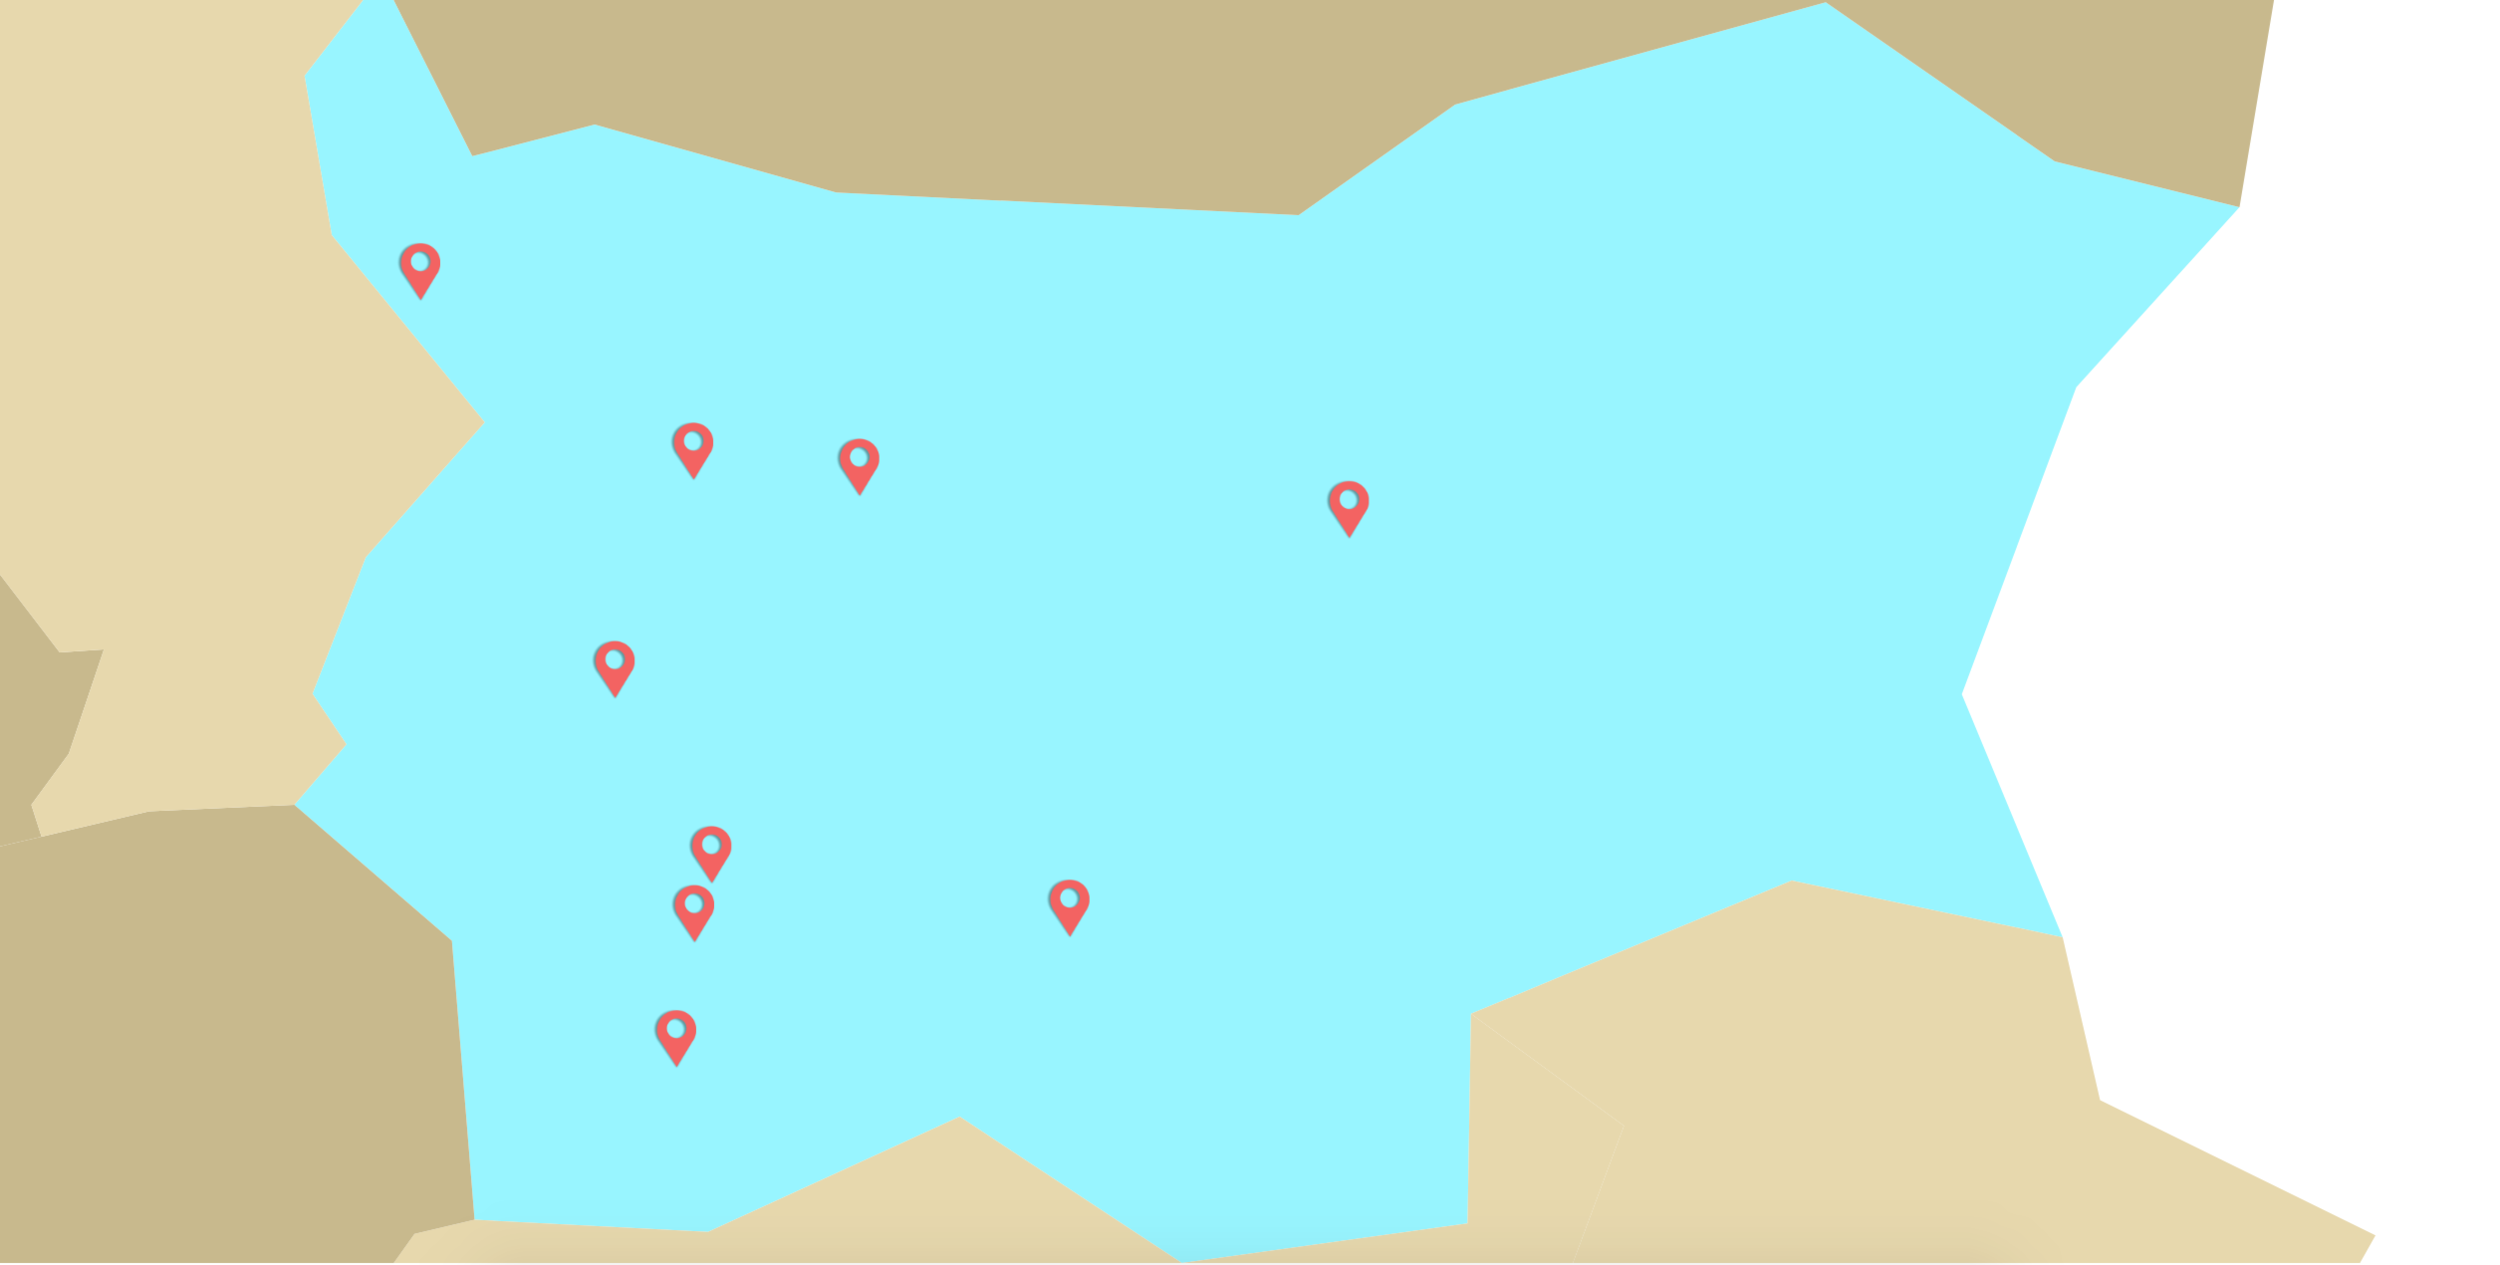
Visited locations in Bulgaria...
2. Location Description
A lot of times points are not enough and we would like to display some information about the point when we interact with it. We will use two tooltips, one for hovering actions and one for clicking. The distinction will become clearer later on.
First let's create the divs for the tooltips themselves:
var tooltip = d3.select("body") //for hover.append("div").attr("class", "tooltip hidden");var tooltip_point = d3.select("body") //for click.append("div").attr("class", "tooltip_point hidden");
We also want to style these so they look prettier when we use them ;-)
.hidden {display: none !important;}div.tooltip {color: #000000;background-color: #fff;border-width: 0.1px;border-style: solid;border-color: #000000;padding: .5em;border-radius: 5px;opacity: 0.9;position: absolute;font-family: "Lato", sans-serif;}div.tooltip_point {color: #000000;background-color: #fff;padding: .5em;border-radius: 5px;border-width: 0.1px;border-style: solid;border-color: #000000;opacity: 0.9;position: absolute;font-family: "Lato", sans-serif;}
The hidden class will serve us to make the tooltip visible and invisible again. Next we want two functions, each for showing one kind of tooltip. We will only go over one but they are very similar and you can find the other in the repository. We also need an inverse functions to hide the tooltip again. We will perform these actions by setting the class of tooltip to hidden and back.
// show point tooltipfunction showTooltipPoint(d){var mouse = d3.mouse(svg.node()).map(function(d) {return parseInt(d);});tooltip_point.classed('hidden', false) //make tooltip visible.html(d.name) //display the name of point.attr('style', //set size of the tooltip'left:' + (mouse[0] + 15) + 'px; top:' + (mouse[1] - 35) + 'px')};// hide point tooltipfunction hideTooltipPoint(d) {tooltip_point.classed('hidden', true); //hide tooltip}
The last thing we need to make it work is to tell D3 when do we want these actions to be triggered. We want the tooltip to appear on hover or click over the location points and so we add the following to the D3 action drawing the points:
g.selectAll("image").data(contained_points).enter().on("mousemove", showTooltip) //hover in.on("mouseout", hideTooltip) //hover out.on("click", showTooltipPoint) //click
The points are now showing tooltip when we hover over and the tooltip stays put once we click on the point:
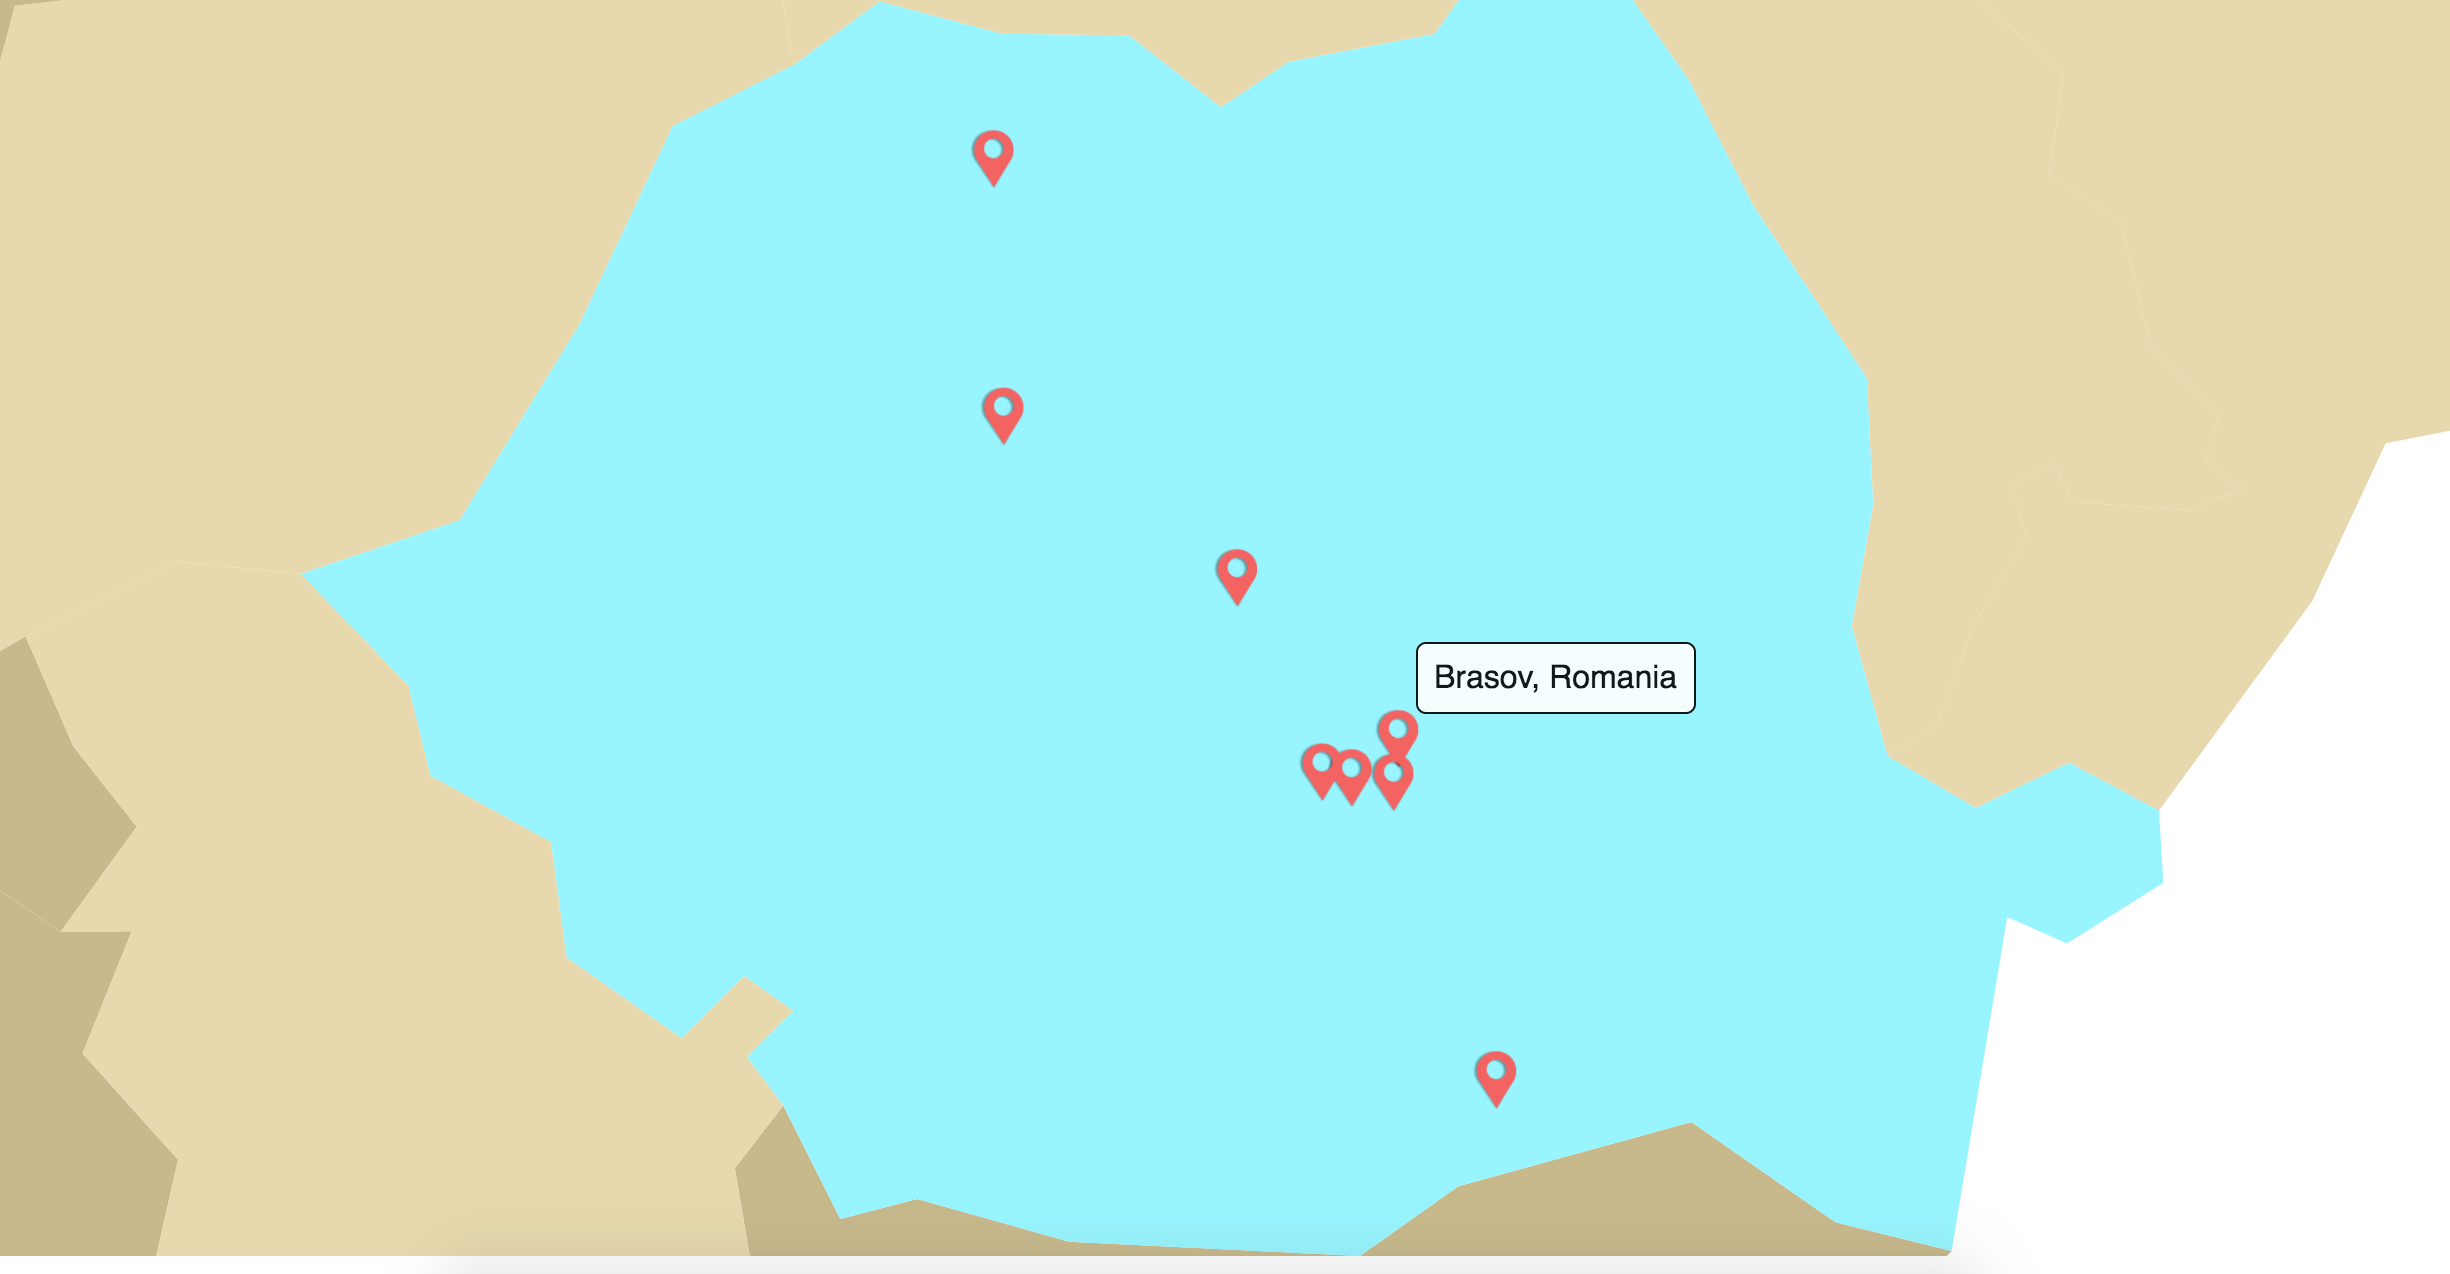
Tooltip on Brasov, Romania
2.1 Adding Links to Tooltips
The last thing we want to do in this part of the tutorial is to add some extra information to the tooltip. We have created quite a bit of content on our blog until this moment. It seems like the map is a great way to browse through it and therefore it would be nice to see all the content available for every location on the map.
To do this, we just need to modify the HTML code, that is being displayed on the clicked tooltip. It will look something like this:
.html("<span id='close' onclick='hideTooltipPoint()'>x</span>" +"<div class='inner_tooltip'>" +"<p>" + d.name + "</p>" +"</div><div>" +getIconsAndLinks(d) +// "</div>")
It adds a little x button to help us close the tooltip, the name of the location and some magic within getIconsAndLinks() function. This function will loop through all of the content available for that location and add appropriate icons and links to the tooltip.
// get icons and linksfunction getIconsAndLinks(posts){keys = Object.keys(posts["posts"]) //get available contentvar st = "";keys.forEach(function(key, index){//if not storyif (key == "NoStory"){var this_img = "<p>Story coming soon...</p>" ;st = this_img} else {//add image linkvar this_img = "<a href='POST_LINK' target='_blank'><img class = 'icon' \title='ICON_KIND' src='ICON_LINK' \alt='' width='50' height='50' /></a>" ;this_img = this_img.replace("POST_LINK", posts["posts"][key]);this_img = this_img.replace("ICON_KIND", key);this_img = this_img.replace("ICON_LINK", icon_links[key]);st += this_img}});return st}
There we have it. It looks something like this:
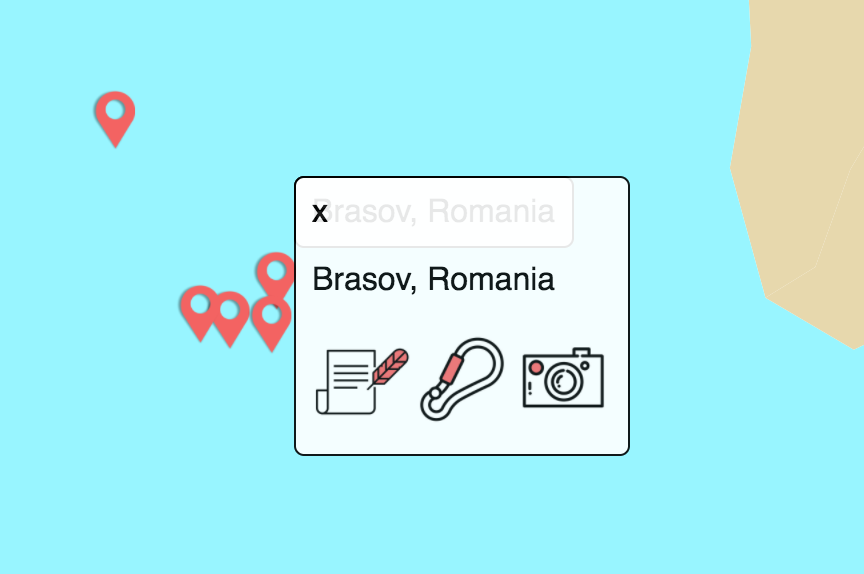
Tooltip with links to content
Some CSS will help us make it look even prettier than that.
#close {float:right; /*display X icon in the corner*/display:inline-block;padding:2px 5px;background:rgba(255, 255, 255, 0);opacity:0.5;color: #f46b6b;}#close:hover { /*make X button more prominent on hover*/float:right;display:inline-block;padding:2px 5px;background:rgba(255, 255, 255, 0);opacity:1;color: #f46b6b;}.icon { /*icons in one row with margins*/display: inline;margin: 0 5px;"}.inner_tooltip { /*icons in one row*/display: inline-block;margin-right: 10px;}
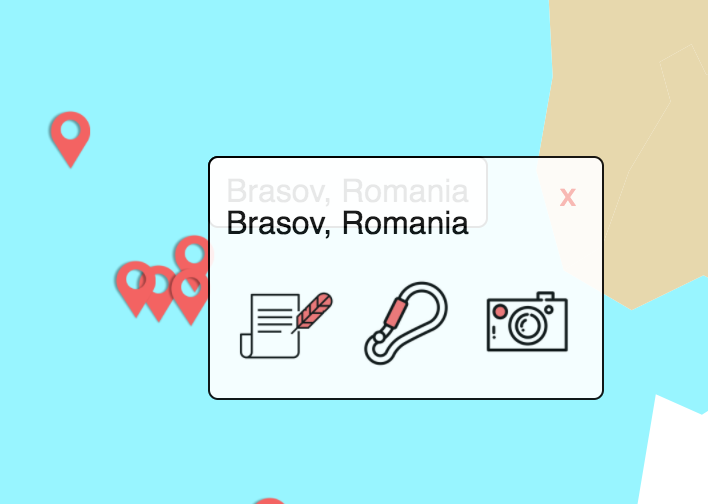
Tooltip with some CSS
Much better no? In this part of the tutorial, we managed to draw all the point belonging to the country you are currently zoomed into. We got familiar with making hover and click actions on objects on the map and learned how to display a tooltip on such actions. Finally, we have managed to make the tooltip different for every point by using data associated with it.
Next Time
In the next (and last) part of the tutorial, we will do some more adjustments to the top level view of the map. You will learn how to make a legend, and interactively select countries based on what data there is available about them.
If you don't want to miss the next parts of the tutorial, sign up for a newsletter in the bottom right corner.
>>>