
Traveling The World in D3 - Part 3: Legend and Filtering

The Knoyd team is currently spread out all over the world (Chile, Colombia and Austria) and I am living on the road for quite a while now. I had an idea to code up an interactive map for our travel blog and thought it would be nice to share with you how to do it yourself.
This is a multi-part tutorial. To get started, you can get all the code from GitHub and also see the final product here.
You can also check out Part 1: Making a Map and Part 2: Points and Links.
Adding a legend
In the last part of the tutorial, we managed to interactively draw location points on the zoomed in country and added a tooltip linking directly to our content. One thing we are missing is an overview of what content is available for which countries without having to manually click through all the points available.
Firstly lets add a legend to the top level view of the map, listing all the available categories of our content.
var
legend_cont
=
d3
.
select
(
"body"
).
append
(
"div"
).
attr
(
"class"
,
"legendContainer"
);
We also need to add some CSS to make it look nicer.
div
.legendContainer
{
color
:
#000000
;
background-color
:
#fff
;
border-width
:
0.1px
;
border-style
:
solid
;
border-color
:
#000000
;
padding
:
.5em
;
border-radius
:
5px
;
opacity
:
0.9
;
position
:
absolute
;
font-family
:
"Lato"
,
sans-serif
;
display
:
table
;
margin
:
auto
;
position
:
absolute
;
top
:
0
;
bottom
:
0
;}
Now we have a little frame but it will not help us much without some data in it. We will get a variable containing all the categories and add it as elements of unordered list. Lets start by just listing the names of the categories.
//create unordered list
var
legend
=
d3
.
select
(
".legendContainer"
).
append
(
"ul"
).
attr
(
"class"
,
"legend"
);
//add list item for every category
var
legend_items
=
legend
.
selectAll
(
"li"
).
data
(
post_cats
).
enter
().
append
(
"li"
).
html
(
function
(
d
,
i
){
return
d
.
name
});
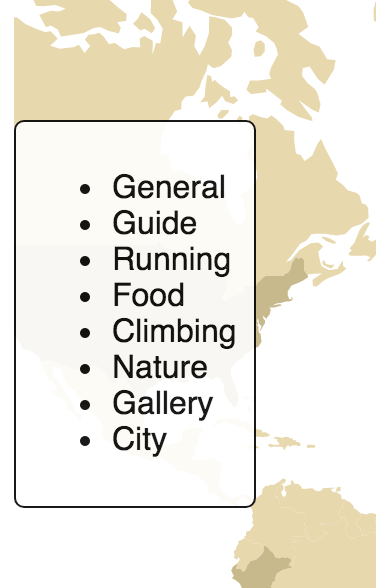
So far it looks pretty ugly
We can apply some CSS to make it look much nicer:
ul
.legend
{
list-style-type
:
none
;
list-style
:
none
;
padding
:
3px
;
vertical-align
:
middle
;
display
:
block
;
line-height
:
50px
;
font-family
:
"Lato"
,
sans-serif
;
cursor
:
pointer
;}
Even cooler would be if we could display an icon instead of just simply the name. Well, we can. First define a little helper function to help us assemble the necessary HTML for each of the icons.
// get legend items
function
getLegend
(
d
){
var
temp
=
"<img class='legend_icon' title='ICON_TITLE' \
src='ICON_LINK' alt='' width='50' height='50'> \
ICON_KIND"
;
temp
=
temp
.
replace
(
"ICON_TITLE"
,
d
.
name
);
temp
=
temp
.
replace
(
"ICON_LINK"
,
d
.
url
);
temp
=
temp
.
replace
(
"ICON_KIND"
,
d
.
name
);
return
(
temp
);};
Then we just have to apply this function in our HTML call while creating the legend list items.
var
legend_items
=
legend
.
selectAll
(
"li"
)
...
//interesting part
.
html
(
function
(
d
,
i
){
return
getLegend
(
d
);});
With the last little bit of CSS, we make the icons aligned with the name of the category.
ul
.legend
img
{
vertical-align
:
middle
;}
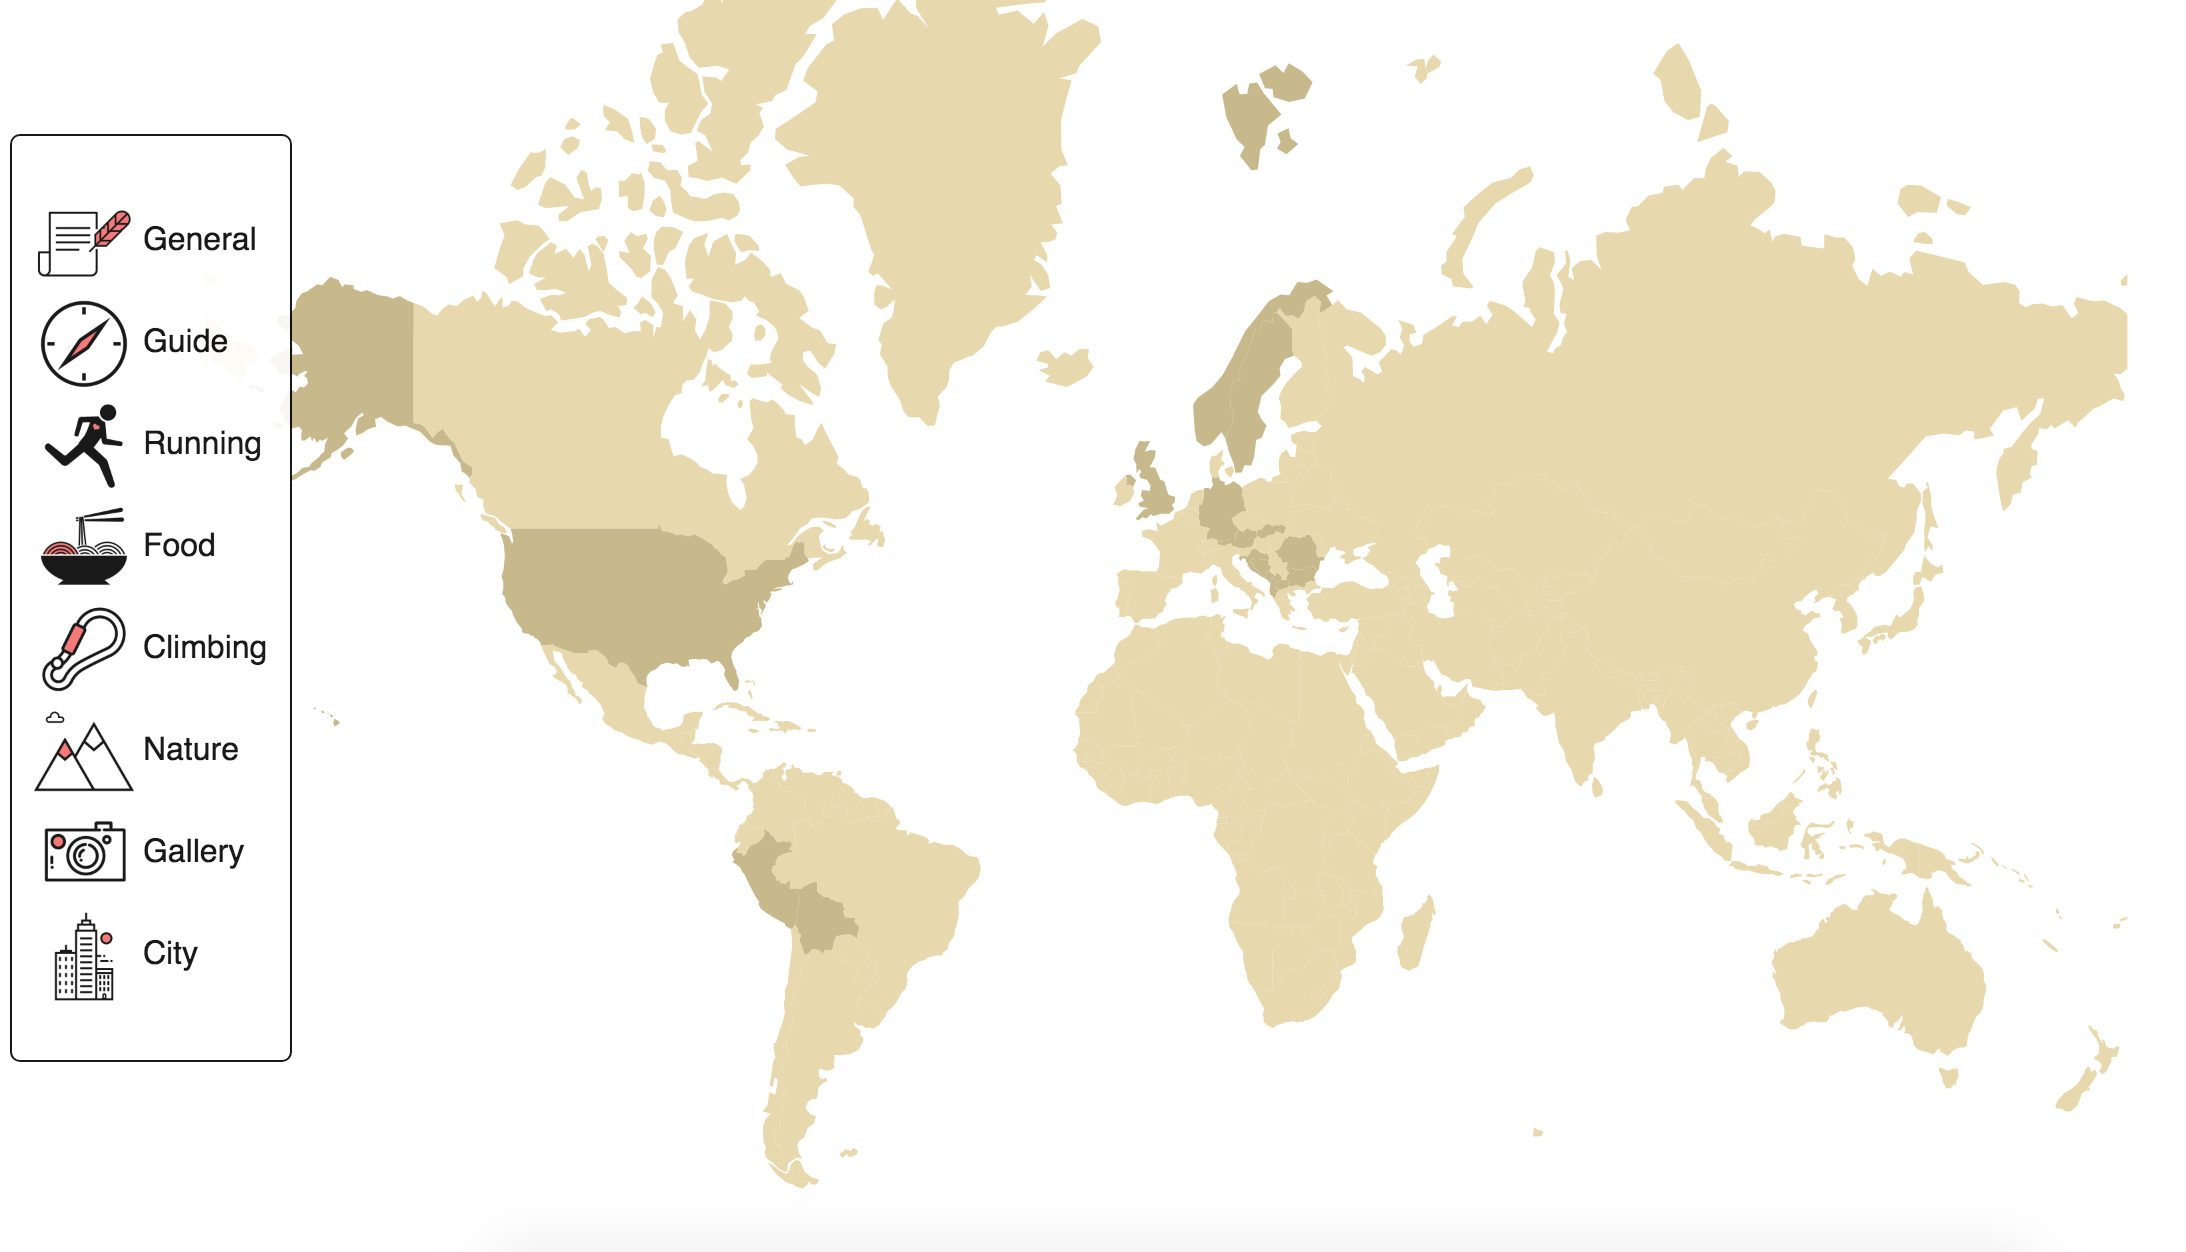
Static legend on a map
We now have a decent looking legend on our map. It is, however a little boring if it's just sitting there. In the next section, we are going to make it do something more interesting.
Filtering the content
A nice straight forward idea to make the legend more interactive is to use it to filter our blog content on interaction. Once we click on one of the items in the legend, we would like to color differently only the countries that contain blog posts in this category. Lets get to it.
First we make a little helper function to help us color individual country, very similar to the one we used in Part 1 of our tutorial.
// color country according to legend
function
colorCountryLegend
(
country
,
active_countries
) {
if
(
active_countries
.
includes
(
country
.
id
)) {
return
'#f56260'
;
//color for selected item
}
else
if
(
visited_countries
.
includes
(
country
.
id
)) {
return
'#c8b98d'
;
//same as in Part 1
}
else
{
return
'#e7d8ad'
;
//same as in Part 1
}};
Next we need a helper function to help us figure out, if a particular country has a piece of content in the kind category that we have clicked on.
function
hasContent
(
s
,
kind
){
var
post_keys
=
Object
.
keys
(
s
.
posts
);
return
post_keys
.
includes
(
kind
)};
Finally we put it all together in one function running the entire process on each click. It selects the countries at hand and colors them using the functions above. (For the data structures used, check the files in the repository)
// color countries for particular legend item
function
colorCountriesCategory
(
d
){
//filter relevant countries using hasContent function
var
these_countries
=
trip_data
.
filter
(
function
(
s
){
return
hasContent
(
s
,
d
.
name
);});
var
active_countries
=
these_countries
.
map
(
function
(
a
) {
return
a
.
country
;});
var
unique
=
active_countries
.
filter
(
function
(
item
,
i
,
ar
){
return
ar
.
indexOf
(
item
)
===
i
; });
//color countries
g
.
selectAll
(
'path'
).
attr
(
'fill'
,
function
(
t
){
return
colorCountryLegend
(
t
,
unique
);});};
All we need to do now is triggering the function by clicking on an icon. We can do this simply by adding the action to theli elements.
var
legend_items
=
legend
.
selectAll
(
"li"
)
...
//here
.
on
(
"click"
,
colorCountriesCategory
).
html
(
function
(
d
,
i
){
return
getLegend
(
d
);});
That's it. There are some little things to take care of with discoloring the countries once you decide to zoom in etc., but these are details left as an exercise for you.
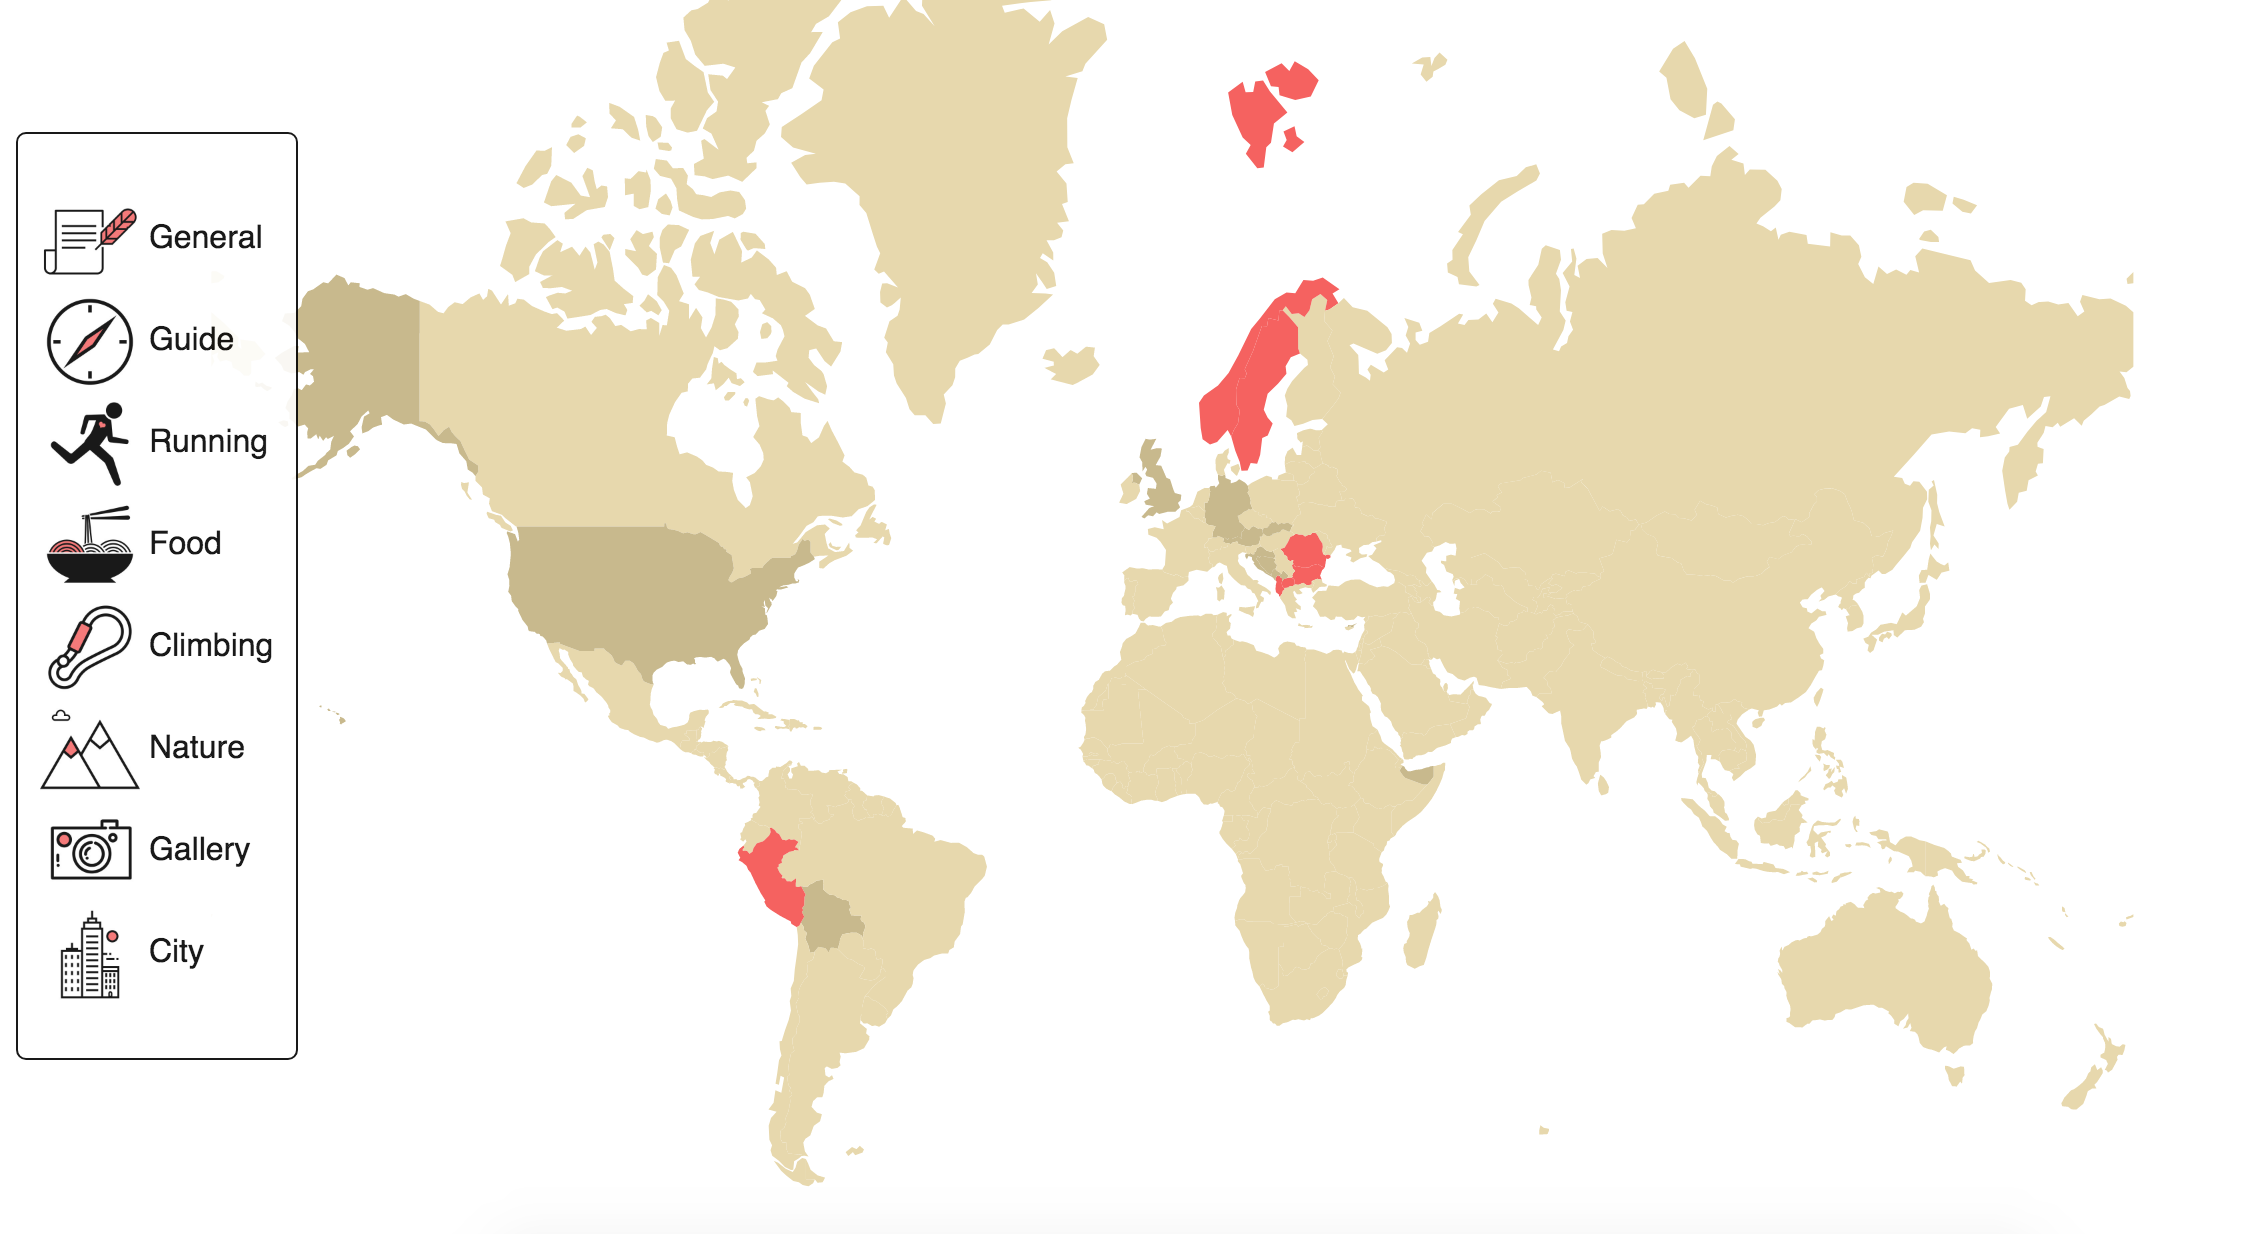
Colored by the legend
Conclusion
In this short tutorial series, we have learned basics of plotting geographical data using the D3.js library. There are plenty of really cool things you can do with D3 and we have only scratched the surface. If you would like to see something else, please write a comment.
In case you are interested in getting deeper knowledge in Data Science, feel free to check our Data Science Bootcamp BaseCamp and sign up :-)