
Behavioral Analysis of GitHub and StackOverflow Users

Which are the most actively used programming languages? Which website is used most often? What is the correlation in usage between the pages Github an StackOverflow?
In this blog post, we will take a look at the activity on websites that became a significant part of development across all areas in, as well as, outside of Data Science: GitHub and StackOverflow. It doesn't matter where developers are from or what their specific focus is, everyone uses these websites. Use cases are, for example, machine learning prototyping, data preparation, operationalization as well as software and web development. We have StackOverflow posts and GitHub commits from open repositories from 1.8.2017 to 15.9.2017. The StackOverflow data was downloaded from StackExchange and GitHub data was taken from Google Public Datasets using BigQuery. Firstly we will check activities on each website separately and afterward, we will look for correlations between the commits and StackOverflow activities.
GitHub
Now, let's look at the GitHub activity.
Number of commits: 2317013Number of programming languages: 318
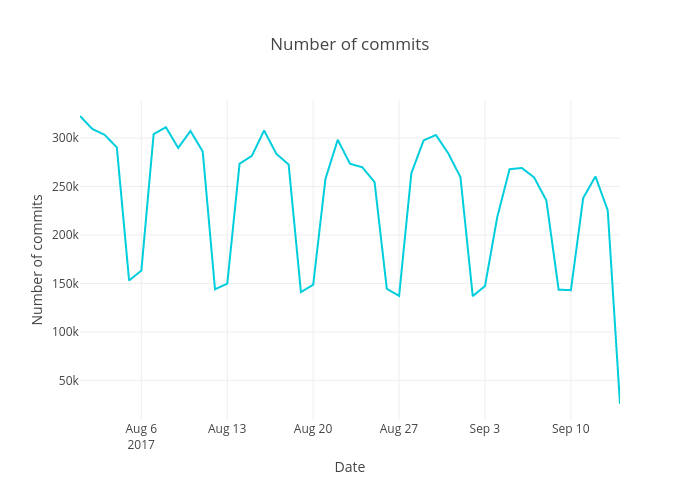
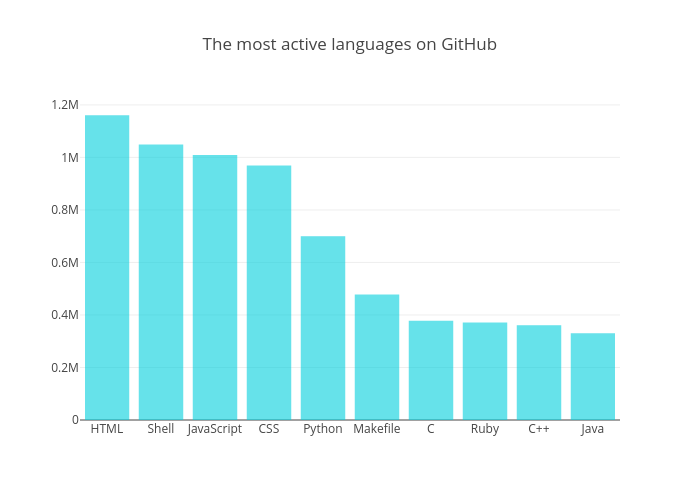
As expected we can see lower activity during the weekend. On the other hand, the peak is always on Wednesday. This means that developers are always the most active in the middle of the week and the number of commits is decreasing closer to the end of the week. The most often used languages in public repositories are python, shell, javascript, CSS, and HTML.
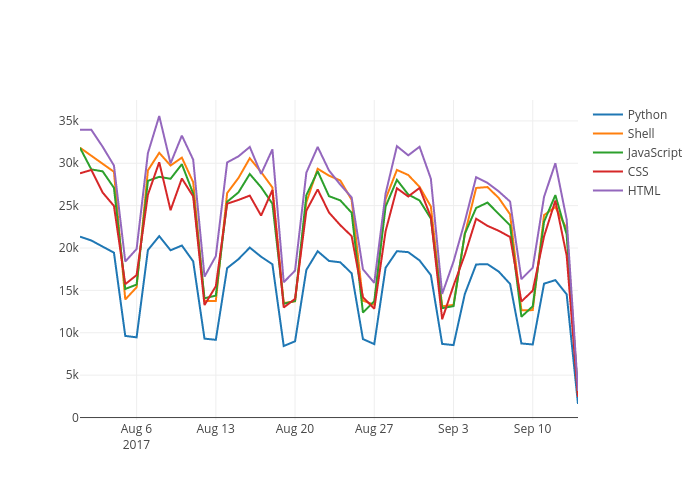
We can see that commits of all popular languages follow the similar curves which reach the maximums in the middle of the week and bottoms during the weekend.
StackOverflow
The second source of data we had was from the StackOverflow website, specifically posts of members that were posted during the observed period. We didn't analyze answers or comments to the older posts.
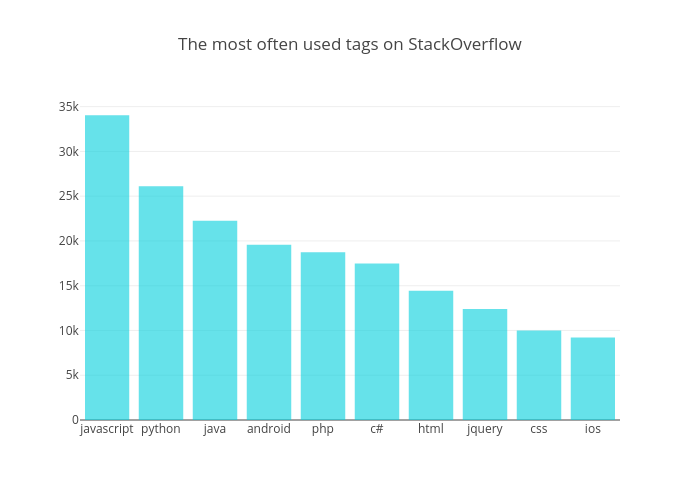
Number of posts: 657199Number of different tags: 26949
We can see that we have significantly less posts. On the other hand we have a lot more tags that make sense because tags are not limited to the programming languages.
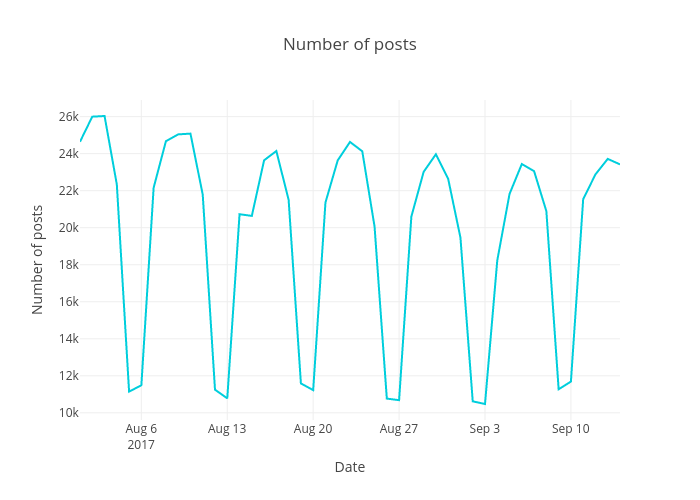
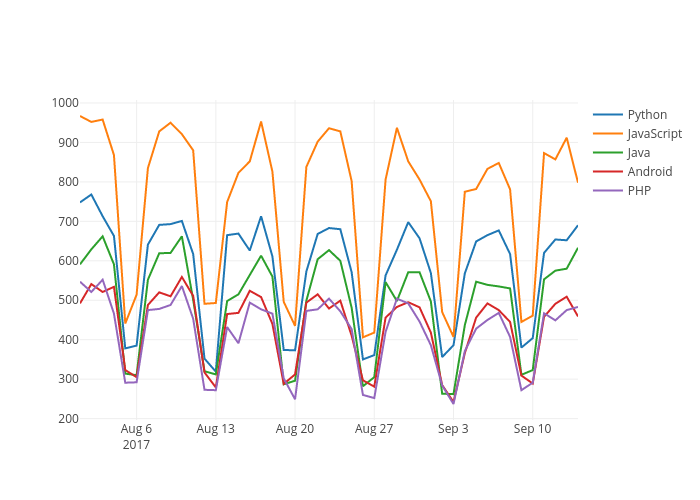
We can see exactly the same pattern as on GitHub, where the number of posts falls approximately to 50% during the weekend with the peak on Wednesday. In this period, the most often used tags on StackOverflow were: javascript, python, java, android, and PHP.
Python and R
We will take a closer look at two programming languages closely related to Data Science: Python and R.
Python
We will take a look at the number of posts from StackOverflow with the tag "python" and number of commits from GitHub in repositories with language "python". We cannot compare the absolute numbers, therefore, we will normalize the values by subtracting the mean and dividing by the standard deviation. Furthermore, we will explore the percentage of "python" commits and posts respectively.
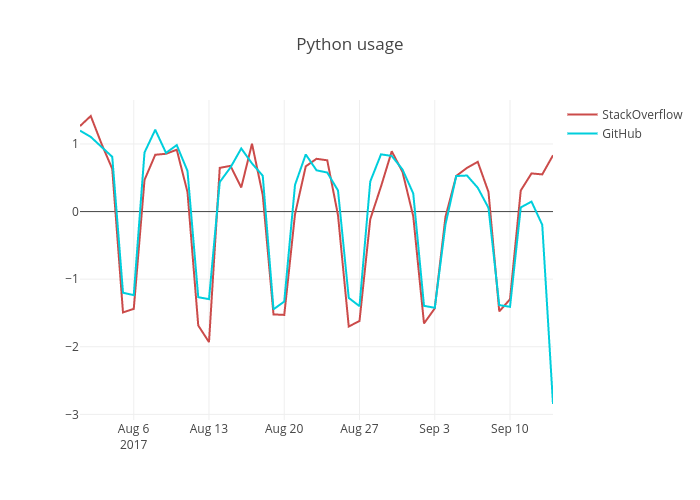
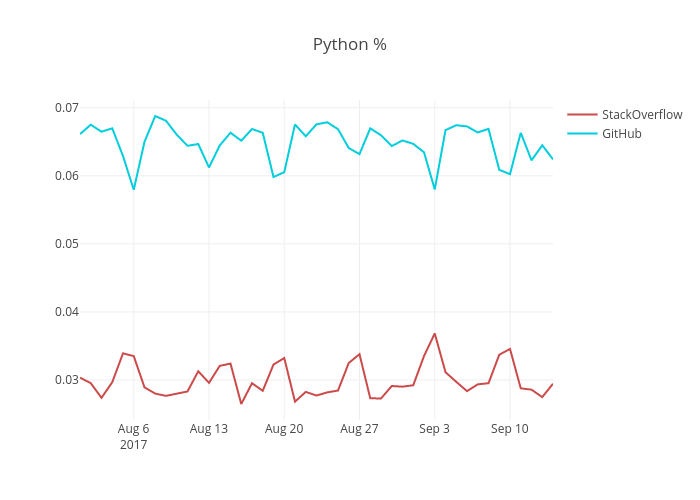
We can see that after normalization, the python related activities follow almost the same curve with correlation coefficient 0.802. The only small difference is the deeper weekend bottoms of the StackOverflow curve. On the other hand, percentages are almost completely opposite, having a correlation coefficient -0.718.
R
We will perform the same analysis on the language R.
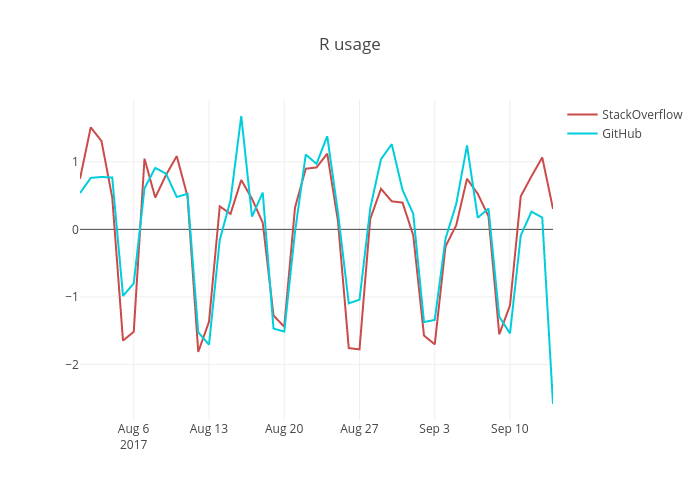
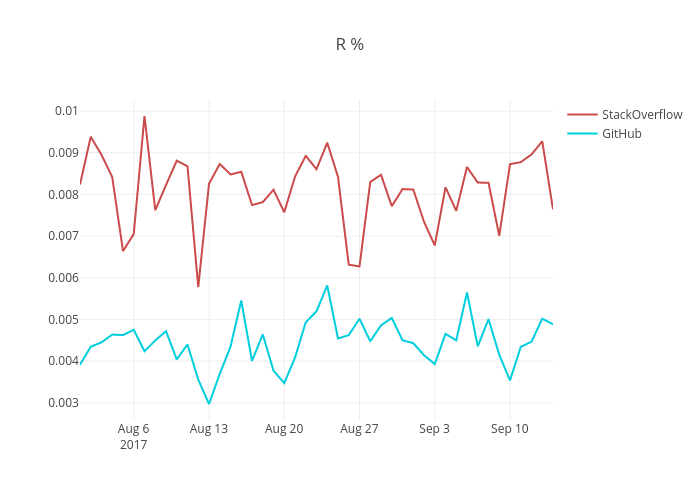
We can see the same pattern in the number of commits and posts using R language and tag. The correlation coefficient is 0.807 which is almost the same as in Python. However, the percentages covered by the R language follow different pattern than Python, showing no dependency on each other, with correlation coefficient 0.167.
SUMMARY
We have taken a look at the languages used in GitHub and tags of posts on StackOverflow. We have identified that work of developers is always peaking on Wednesday, in the middle of the week. The used language has no effect on this, and the behaviour was always the same. Interestingly, percentages of commits and posts covered by the language Python vary and show exactly the opposite pattern, with a correlation coefficient -0.718.