
Exploring the Neighbourhoods of Vienna with Open data
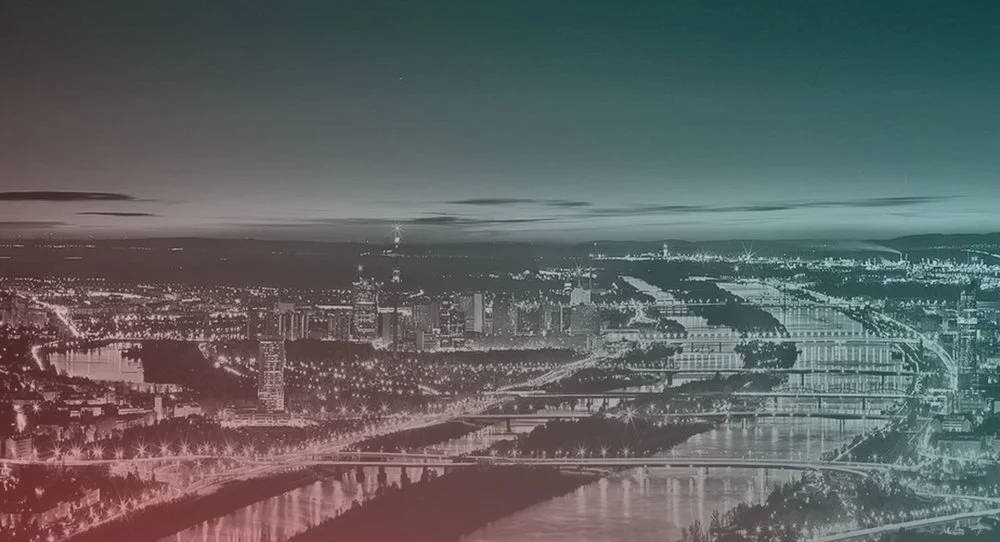
In this article, we look at 'the built environment', which Wikipedia describes as "human-made surroundings that provide the base for human activity, containing everything from parks, public transport or hospitals to coffees, bars, and restaurants." Recently, we have seen the expansion of smart cities as well as data-driven approaches to urbanism. This means that people are trying to use data to better understand how they live, how different neighbourhoods are built, and what the similarities between them are. One way to do it is to explore the neighbourhoods through open data.
Data Sources Description
For this blog post, we have chosen the city of Vienna, Austria for the following reasons:
Size of the city
Availability of open datasets
Soft spot for the city because I lived there ;-)
If you have visited Vienna before, you might have seen the famous St. Stephen's Cathedral, tried the traditional Wiener Schnitzel, but you also know that the city is divided into 23 districts. These districts play an important part for Viennese people. Actually to such extent that one of the first questions locals usually ask you is: "Which district do you live in?" The goal of this blog post is to analyse these districts (neighbourhoods) using public data sources to find differences and similarities among them. We have used three different types of data sources: Vienna open data, scraping of various real-estate agencies websites using BeautifulSoup, and the Google Places API.
Approach
We decided to use a clustering algorithm so that we can assign the same cluster to similar neighbourhoods. For this, we have used information pulled from the Google Places API. We gathered the number of various places per district, including doctors, restaurants, bars, coffee shops, parks, museums, galleries, and even beauty and hair care salons. With regard to the number and type of these places, the two closest districts are 4 (Wieden) and 6 (Mariahilf), with only 16-point distance, while the distance between the two most distinct neighbourhoods (22 (Donaustadt) and 5 (Margareten)) was 180.
We excluded any demographic or economic indicators from the clustering but some interesting relationships were found between the clusters. Furthermore, we have scraped the actual prices of houses and apartments in Vienna from a couple of real-estate websites to further enhance the profiles of our clusters. The distribution of apartment prices can be seen in the following charts:
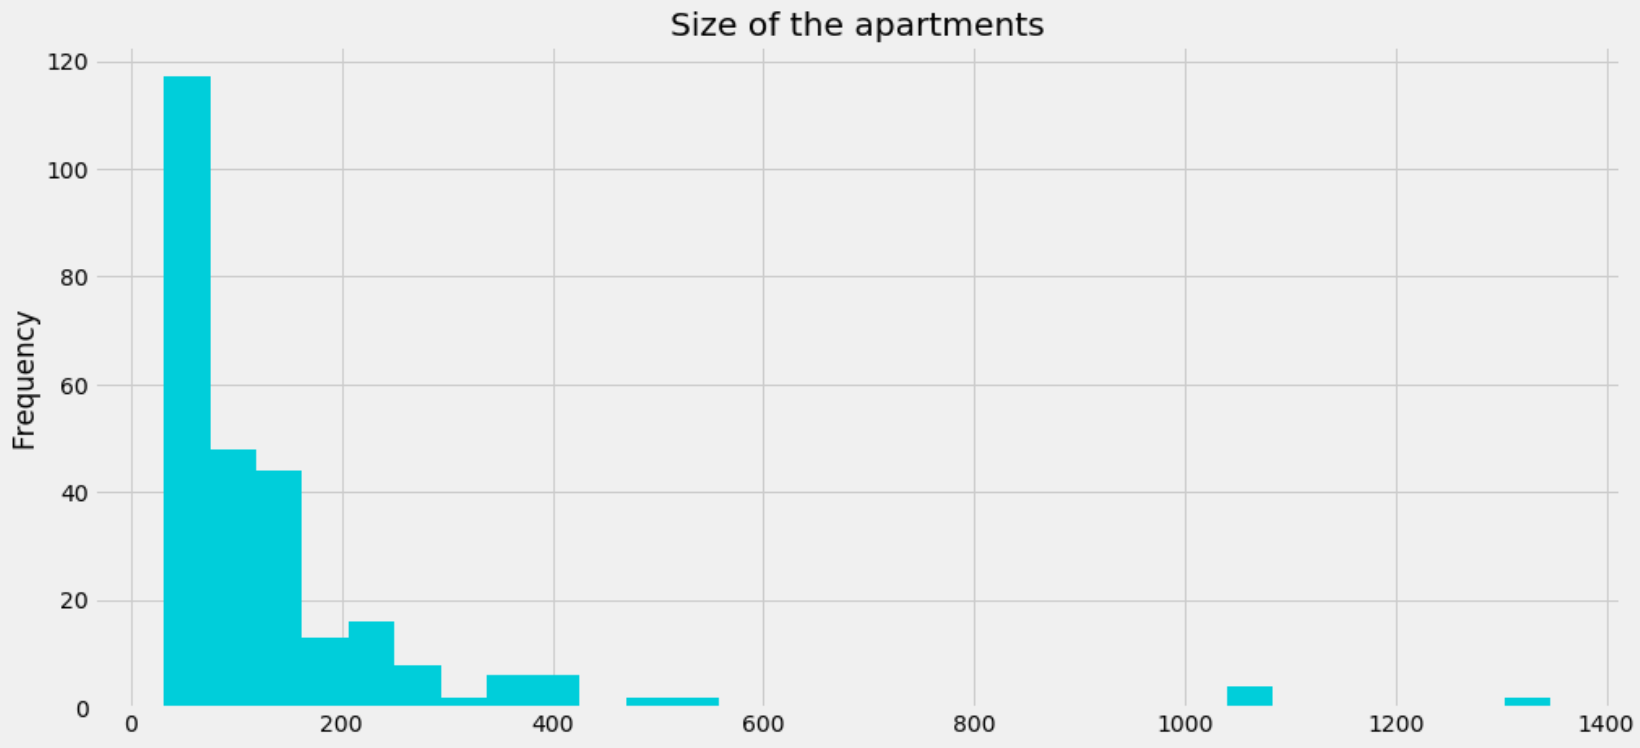
Histogram of sizes of apartments that are currently for sale in Vienna
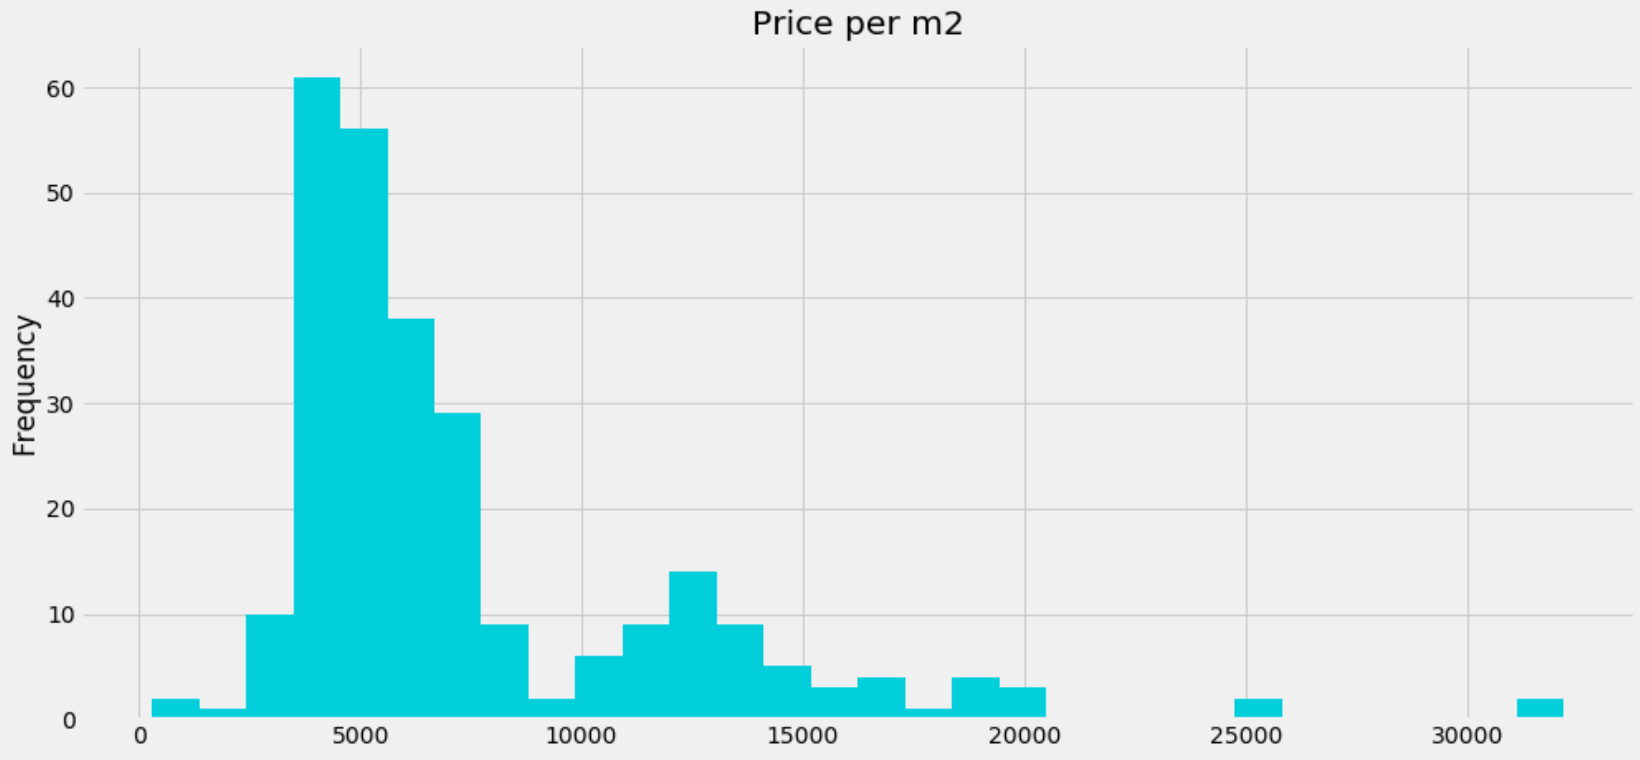
Histogram of prices per m2 of apartments that are currently for sale in Vienna
The Solution
Using the places pulled from Google API, we have clustered the neighborhoods into 5 different clusters.
Cluster number  Districts
--------------------------------------------------------------
Cluster 1       1010
Cluster 2       1020 - 1130
Cluster 3       1030 - 1100 - 1110 - 1140 - 1190
Cluster 4       1040 - 1050 - 1060 - 1070 - 1080 -1090 - 1120 -
                1150 - 1160 - 1170 - 1180 - 1200
Cluster 5       1210 - 1220 -1230
Cluster 1 consists only of the district number 1 (Innere Stadt), because is very far away from any other district. This was further proven by profiling, using demographic data and prices of apartments. This district is home to some of Vienna's biggest attractions such as St. Stephans Cathedral, Hofburg Palace, and the famous Opera House.
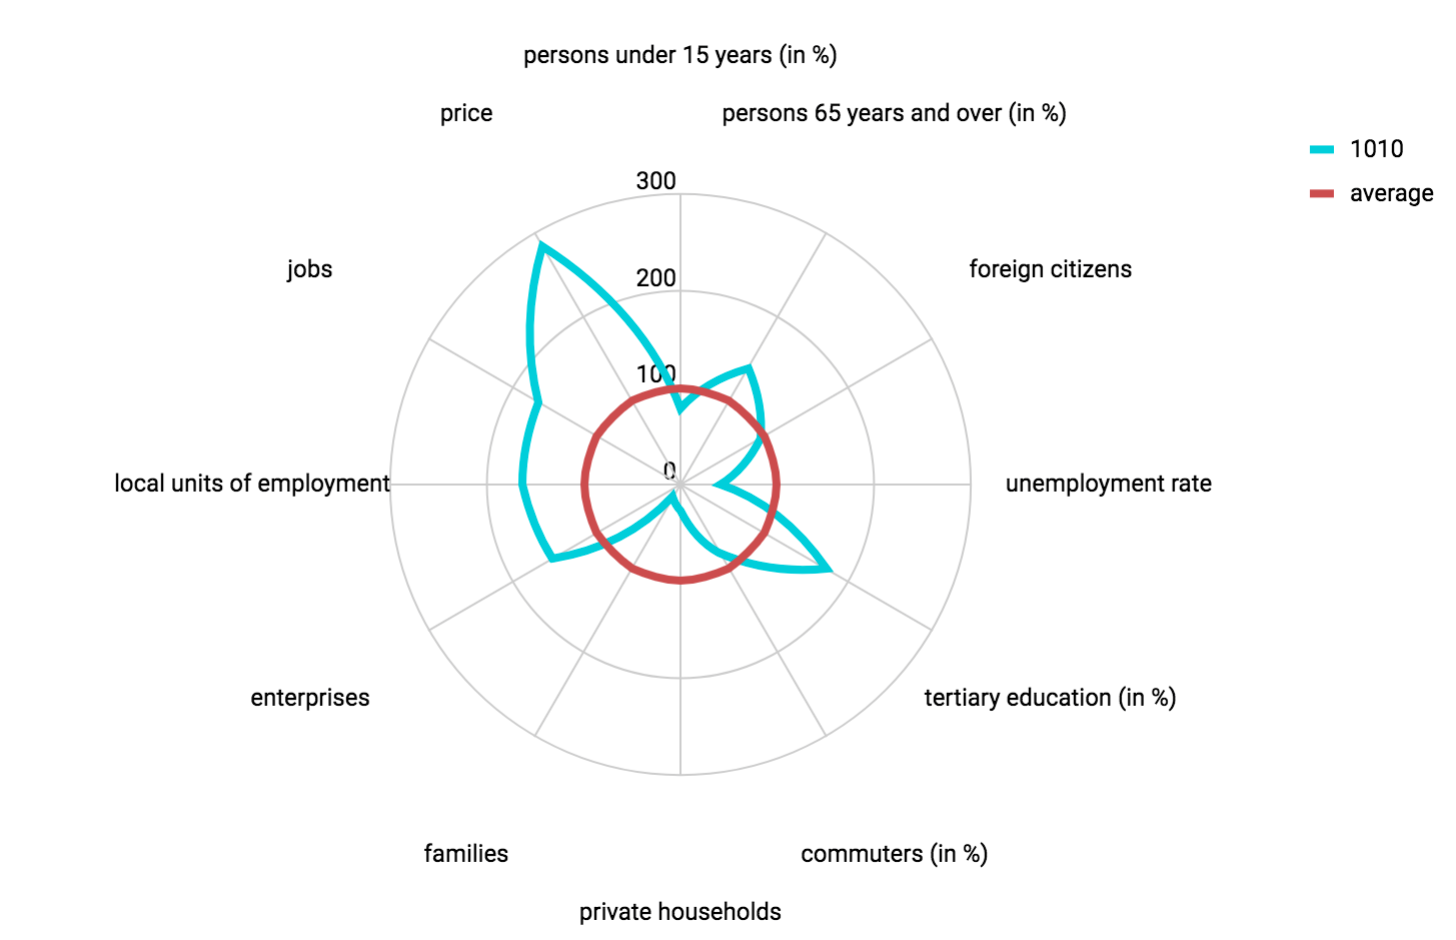
Comparison of District Innere Stadt against average values in Vienna
We can see that District 1 is very far from the average in various categories, especially the apartment prices, which are almost 3-times higher than the overall Viennese average — despite the fact that the royal apartments in the Hofburg Palace aren't currently for sale. Also we can see, that people who live here are older on average, which leads to significantly fewer families compared to other parts of the city.
As we can see in other clusters, it is often the case that similarity doesn't always coincide with geographical distance of the neighbourhoods. For example, in cluster 3, there are districts that are far from each other on the map, like 11 (Simmering) and 14 (Penzing). However, they are pretty close in terms of demographics and apartment prices. Be also aware that the clustering algorithm has never seen these latter attributes. The clustering was done purely based on the places pulled from Google API.
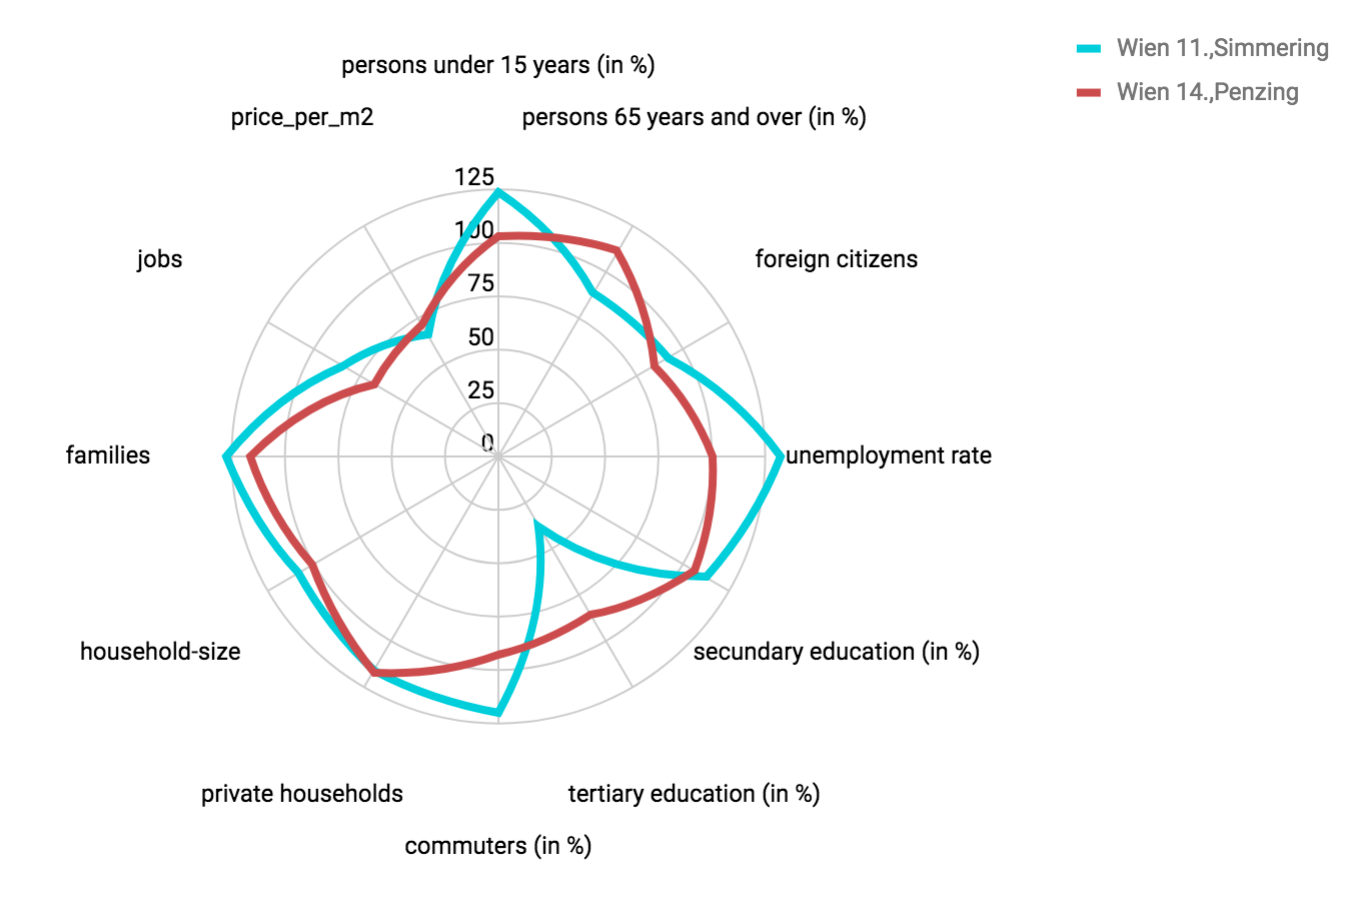
The comparison of 2 districts in the same cluster
Another interesting finding was, that two districts which are separated from the rest of the city by the Danube River are together in one cluster. However, they are very similar to district no. 23, which is on the opposite side of Vienna.
Summary
Nowadays, there is a lot of relevant information publicly available either as an open data initiative, APIs, or simply as content on various websites. In order to keep up with current trends, it is crucial for any organisation, whether it is a public or a private one, to use this information for their own or people's benefit. If you are currently thinking about tackling a similar problem or struggling with processing a lot of information, don't hesitate to contact us.